


Performance Bargraph
The Performance Bargraph allows to get a really quick overview or where is spent time when computating a frame data.
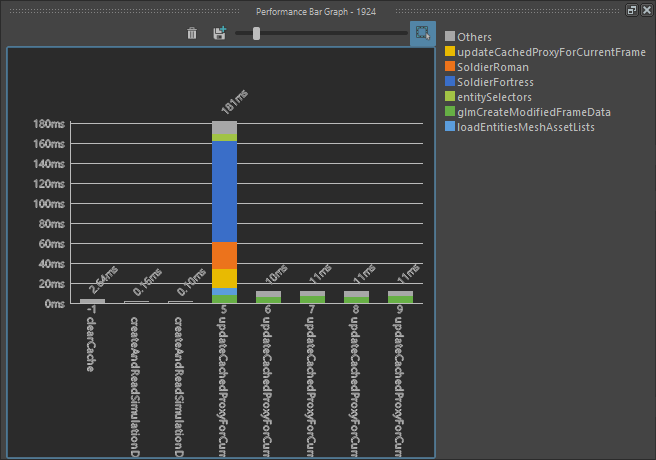
Performance Bargraph window
Tool bar
 |
Clear data only in this window |
 |
Take a screenshot (.png) |
 |
Change the zoom on events |
 |
Automatic focus to display the whole cache |
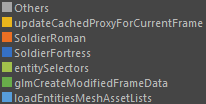 |
Caption for each color in the bargraph |
Performance Bargraph
The bargraph shows the time spent to compute each specific event.
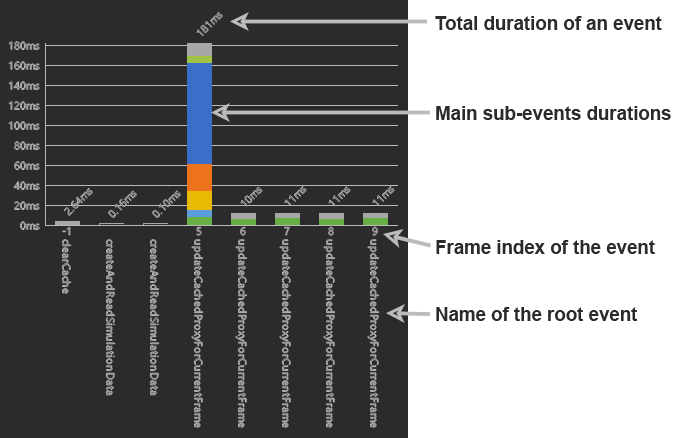
Signification of the bar graph
Each sub-event in a bar has a tooltip that help identifying its name and exact duration.
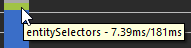
Sub-event tooltip