


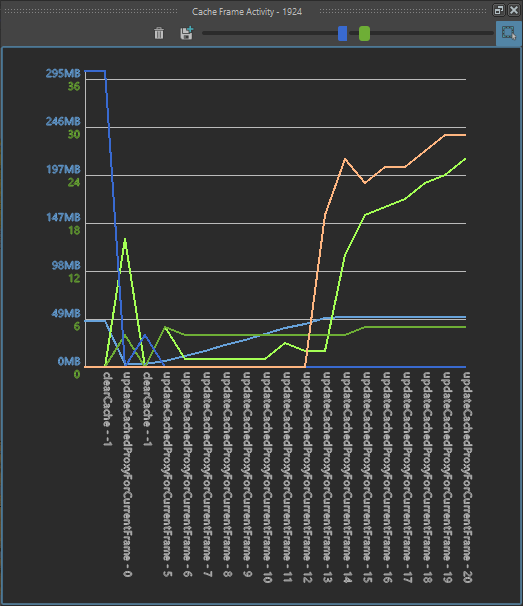
Cache Frame Activity
Cache Activity window
Tool bar
 |
Clear data only in this window |
 |
Take a screenshot (.png) |
 |
Change the zoom for the memory icupation |
 |
Change the zoom for the count of event |
 |
Automatic focus to display the whole cache |
Cache Activity
The cache activity display two things:
- — the memory usage of the cache. The scale corresponding to this is the one written in blue characters, in MB
- the activity of frames in the layout cache. The scale corresponding to this is the one written in green characters, in number of events. There are 5 different curves to display the count of events:
 count of source frame data that were loaded from the disk or interpolated
 count of modified frame data (a frame data with layout transformations) that were computed
 count of frame data that were removed due to user action (a click on refresh cache, or a change in parameter value that invalidated some node...)
 count of source frame data that were destroyed because the max layout cache size was reached
 count of modified frame data that were destroyed because the max layout cache size was reached
On usual cases, the green curves have a bigger value at the beginning (if the layout uses reference frames that needs to be loaded) and should then be stable as long as there is enough memory in the cache to fill it.
The red curves should stay to zero untill the cache is full. When it starts to grow, it means the cache is full, and the performances might be altered when replaying the cache (if all frames can't be in cache at the same time, then it mean they will need to be recomputed next time the frame index is asked). When this happen, consider looking for the other windows of the profiler tool to understand the reason, and eventually increasing the layout cache size.
Here is an exemple of how to read a cache activity:
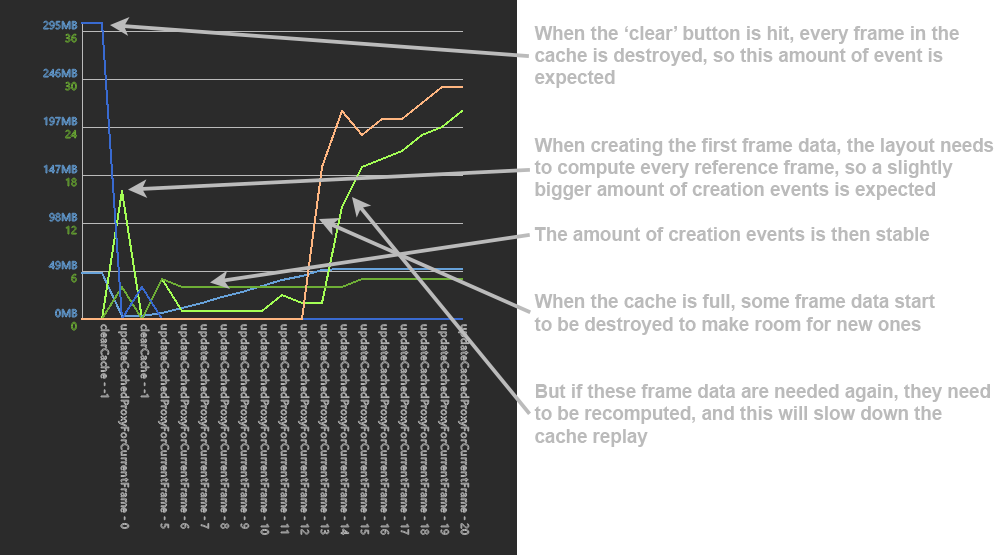
Cache activity exemple