


Performance Timeline
As of August 5th, 2025, Golaem will no longer provide direct support.
All support for Autodesk Golaem will now be handled exclusively through Autodesk support channels and this website will be deactivated soon.
Please bookmark the Autodesk Golaem Support section for any future support needs related to Autodesk Golaem packages.
Performance Timeline window
Tool bar
 |
Clear data only in this window |
 |
Take a screenshot (.png) |
 |
Change the zoom on events |
 |
Automatic focus on the last event |
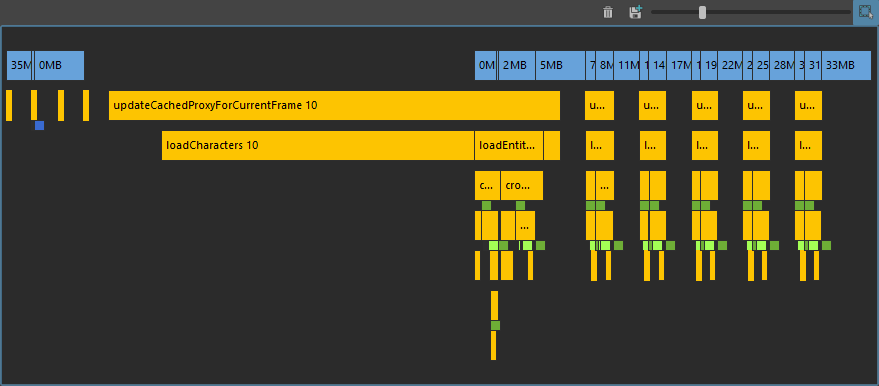
Timeline
The timeline displays all events that are received in the order they are received from left (oldest) to right (newest). There are 3 main types of events:
 cache size events are displayed in blue, alows on the upper part of the timeline. It simply shows the amount of cache used by the frames that are currently loaded
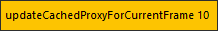 perf events represent the time spent to perform a given part of the layout computation.
- The name of the event (updateCachedProxyForCurrentFrame) might be followed by a number (10) that represent the frame index for which this events occurs.
- Displayed in yellow once finished, or in orange while still in progress.
- the width of the event represents the time it took to fully perform the computation, the exact time is given on the tooltip
- frame data creation events: shows frames that are added to the cache.
 source frame data from the disk (or an interpolation of frames from the disk)
 frame data with some layout modifications
- frame data destruction events: shows frame that are removed from the cache and destroyed
 frame data that are cleared from the cache because of user interaction (click on the refresh button, change a parameter that invalide the frame data...)
 (src) or
  (layout) are frame data that are destroyed because the memory reserved for the cache is full, and some space needs to be made
Call stack
Except for the memory events, all events in the timeline are displayed in what is called a "call stack". It simply means that the way events are displayed tells if an event is part of an other or not.
For instance, here is a typical call stack that can be displayed on the timeline:
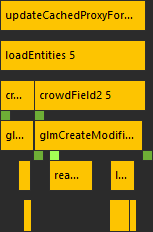
A callstack in the Performance Timeline
Which can be described as follow:
- the updateCachedProxyFor... function is called
- which calls for the loadEntities function
- which calls the crowdField1 computations
- creating a frame data with layout modifications () to store the result of the layout
- calling for the glmCreateModifiedFrameData function to compute the layout
- calling another unnamed function
- and again calling another unnamed function
- calling another unnamed function
- creating a frame data with layout modifications (
- loadEntities also calls the crowdField2 computations after the crowdField1 computations are done
- creating a frame data with layout modifications () to store the result of the layout
- calling for the glmCreateModifiedFrameData function to compute the layout
- creating a frame data with layout modifications ()
- creating a source frame data ()
- calling readFrameData function to load the frame from disk
- calling layoutTransformations to compute the layout transformations
- calling each node in the layout file one after the other, but each individual node can't be seen here because it akes too little time
- creating a frame data with layout modifications (
- creating a frame data with layout modifications (
- which calls the crowdField1 computations
- which calls for the loadEntities function
Note that each named performance events is detailled here: http://golaem.com/content/doc/golaem-crowd-documentation/profiled-events
This call stack display allows to find generic information by looking only at the upper part of the call stack (for instance, the update of the cache proxy took 14.9ms: 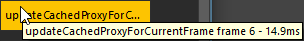 ), or very detailled information by looking at the lower part of the call stack (the time spent in the update of the cache proxy is composed of 3.7ms for the crowdField1
 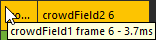 and 11.2ms for the crowdField2
 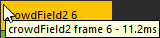 ).
).