


Performance Bargraph
As of August 5th, 2025, Golaem will no longer provide direct support.
All support for Autodesk Golaem will now be handled exclusively through Autodesk support channels and this website will be deactivated.
Please bookmark the Autodesk Golaem Support section for any future support needs related to Autodesk Golaem packages.
The Performance Bargraph allows to get a really quick overview or where is spent time when computating a frame data.
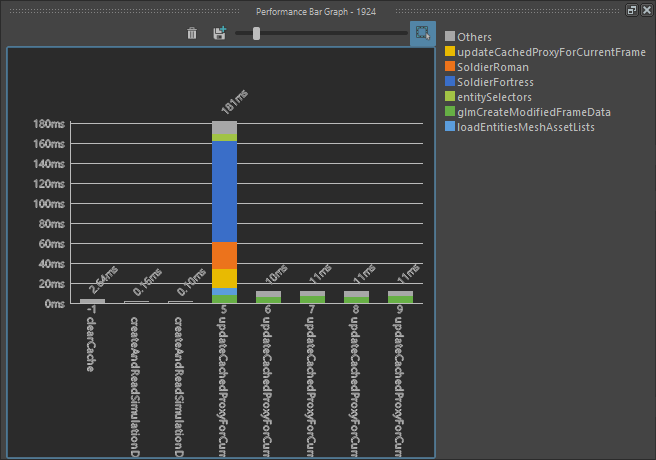
Performance Bargraph window
Tool bar
 |
Clear data only in this window |
 |
Take a screenshot (.png) |
 |
Change the zoom on events |
 |
Automatic focus to display the whole cache |
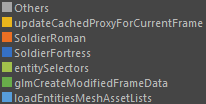 |
Caption for each color in the bargraph |
Performance Bargraph
The bargraph shows the time spent to compute each specific event.
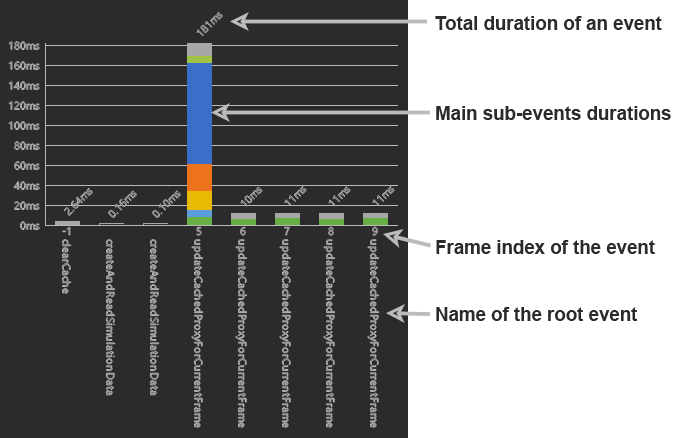
Signification of the bar graph
Each sub-event in a bar has a tooltip that help identifying its name and exact duration.
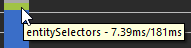
Sub-event tooltip